General Corrosion Behavior and Trends
Compatibility of molten salts with structural alloys centers on the potential for oxidation of the structural metal from the elemental state to the corresponding fluorides or chlorides with corresponding reduction of the oxidizing agent. Because molten salts are ionic and therefore electrical conductors, oxidation-reduction reactions will occur readily in this medium. Such oxidation-reduction (corrosion) can occur by several processes, including:
1.Intrinsic corrosion (uniform surface corrosion) with molten salt as the reactant; this mechanism pertains primarily to nitrates and nitrites, not to fluorides or chlorides.
2.Corrosion by oxidizing contaminants in the molten salts (such as HF, HCl, H2O), residual oxides of metals, or easily reducible ions, especially some polyvalent metal ions. Impurities in the melt or in the gas phase control the corrosion/oxidation potential of the melt, increase the anodic reaction rate, or change the acidic or basic nature of the melt.
3.Differential solubility due to thermal gradients (between hot and cold zones) in the molten salt system with formation of a metal ion concentration cell that drives corrosion.
4.Galvanic corrosion, wherein alloys with differing electromotive potentials are maintained in electrical contact by the molten salt, driving the oxidation of the anodic material.
The laws of electrochemistry and mechanisms of corrosion are comparable for aqueous solutions and molten salts. The following corrosion mechanisms, which are commonly seen in aqueous environments, are also pertinent to molten salts (Lovering, 1983; Heine, 1982; Kane, 2003):
1.Uniform surface corrosion
2.Pitting corrosion
3. Intergranular corrosion
4.Galvanic corrosion.
In most corrosion and oxidation processes, alloys derive their resistance to corrosion from thin but dense, adherent protective oxide layers that passivate the surface. These generally are chromium, aluminum, or silicon oxide, which limit the diffusion of oxidants to the underlying alloy surface. Molten fluorides (and possibly chlorides) are excellent fluxes for oxides and will convert the metal oxide to the 6 corresponding fluorides (or chlorides), which often are soluble in the molten salt (Kane, 2003; Lovering, 1983). If the supply of oxidant is limited, as in the case of salt impurities in a sealed system, then the corrosion process will be limited and will cease once the oxidants are expended.
In general, there are three driving forces for corrosion in molten fluorides: impurities, temperature gradients, and activity gradients. The most common impurities in fluoride and chloride salts are oxides and hydroxides formed in the salt by its main constituents during contact with H2O and O2 in air, as well as less prevalent metal impurities. H2O and oxides are among the most deleterious contaminants in a molten fluoride salt from the standpoint of corrosion. The reaction of alkali fluorides with moisture generates gaseous HF that can then attack alloys.
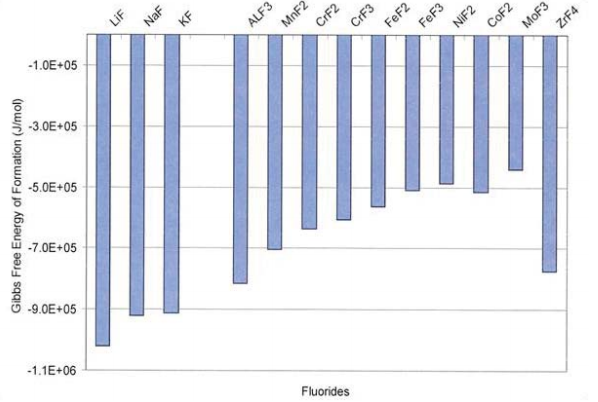
The difference in the free energy of the salt constituents and the fluorides of the alloying elements is the key driving force for corrosion (Misra, 1987). Therefore, alkali metals (i.e., Li, Na, K) are the preferred cations for the salt constituents, and more noble materials (i.e., Ni) are appropriate for the structural container walls (Misra, 1987). Thus, alloys whose constituents have less negative free energies of fluoride formation are less prone to corrosion, and hence better candidates for heat transfer applications from a corrosion standpoint (Anderson et al., 2010).
Gibbs free energy of fluoride formation per F2 molecule of various metals present in the salt and materials at 1,027°C is shown in Figure 2. The more negative the Gibb’s free energy of formation an alloy constituent is in comparison to the salt constituents, the more likely it is to dissolve in molten salt.

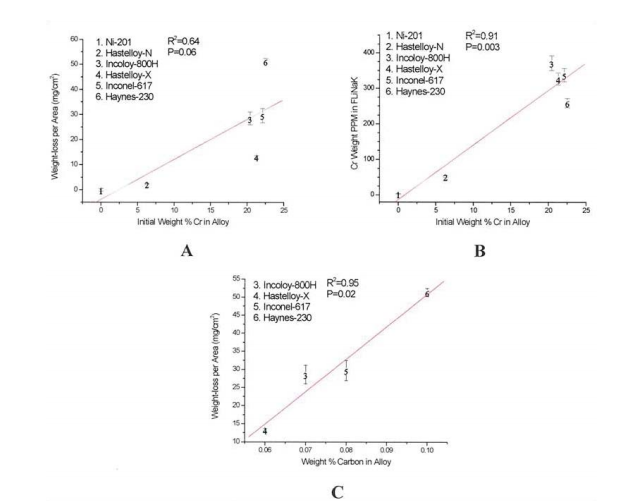
From corrosion tests performed in FLiNaK at the UW-Madison, it was found that the weight-loss per area of the exposed coupons correlated with the initial chromium content of the alloy as shown in Figure 3 (Olson 2009).
